
PPM to Cpk Calculator
Instantly convert defect rate (PPM or DPMO) into statistical process capability (Cpk) and sigma levels.
Short-Term (No 1.5σ Shift)
Long-Term (1.5σ Shift)
Z = NORMSINV(1 − PPM/1,000,000)Cpk = Z / 3Short-Term assumes 0σ shift; Long-Term applies the classic 1.5σ offset.
Typical benchmarks: 3σ = 66,807 PPM, 4σ = 6,210 PPM, 6σ = 3.4 PPM.
PPM to Cpk & Sigma Level Calculator – Quality & Six Sigma Tool
In the world of quality control and process improvement, numbers tell a story. Two of the most important characters in this story are PPM (Parts Per Million) and Cpk (Process Capability Index). While they might sound complex, they are powerful tools for understanding how well a process is performing.
Our PPM to Cpk Calculator is designed to bridge the gap between these two crucial metrics effortlessly.
How to Use the PPM to Cpk Calculator
Our calculator is designed to be intuitive and straightforward. It performs two-way conversions, allowing you to switch between PPM and Cpk seamlessly.
Converting PPM to Cpk:
- Locate the “PPM to Cpk” section on the left side of the calculator.
- Enter the PPM value you want to convert into the input field labeled “PPM.” This value represents the number of defective parts you expect to find in one million units.
- Click the “Calculate Cpk” button.
- The calculator will instantly display the corresponding Cpk value in the result box below. This Cpk value tells you how capable your process is of meeting its specifications.
Converting Cpk to PPM:
- Navigate to the “Cpk to PPM” section on the right.
- Enter your known Cpk value into the input field labeled “Cpk.”
- Click the “Calculate PPM” button.
- The tool will immediately calculate and show the equivalent PPM value. This helps you understand the practical defect rate implied by your process capability.
Behind the Numbers: Formula & Conversion Explained
To truly appreciate the calculator, it helps to understand what PPM and Cpk represent and how they are mathematically linked. They are two different ways of looking at the same thing: process performance and quality.
What is PPM (Parts Per Million)?
PPM is the most direct measure of quality. It simply tells you how many defective items or errors you can expect for every million opportunities.
- Low PPM: A low PPM value (like 2, 25, or 200) is excellent. It means your process is highly consistent and produces very few defects.
- High PPM: A high PPM value (like 20,000 or 50,000) indicates a significant quality problem that needs attention.
Think of it like a professional archer. If an archer shoots one million arrows and only misses the bullseye 3 times, their “PPM” for missing is 3. It’s a simple, universal measure of failure rate.
What is Cpk (Process Capability Index)?
Cpk is a more sophisticated metric. It doesn’t just count defects; it measures how well your process is centered within its specification limits and how much variation it has.
In simpler terms, Cpk answers two questions:
- Is your process centered on the target? (Are you aiming for the bullseye?)
- How wide is your process variation? (How tightly are your arrows grouped?)
A Cpk value is a single number that summarizes this.
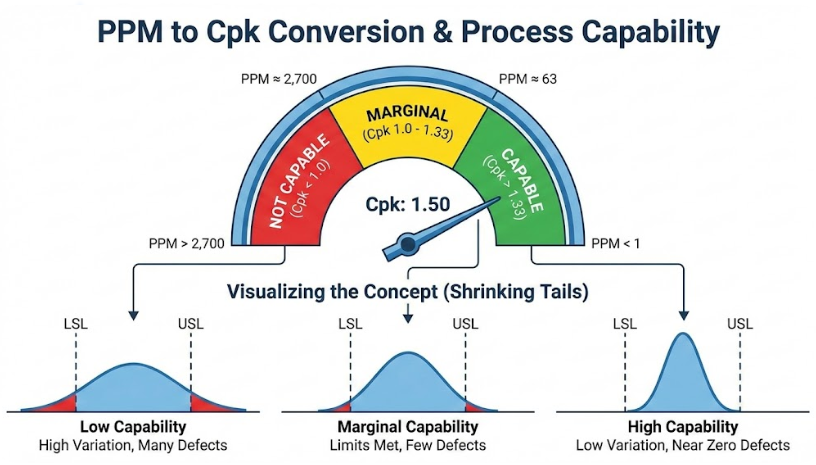
- Cpk < 1.0: The process is not capable. It’s producing defects because its variation is wider than its specification limits. The archer’s arrows are spread so wide that many are missing the target entirely.
- Cpk = 1.0: The process is marginally capable. The spread of the process exactly matches the specification limits. Any small shift will result in defects. The archer’s tightest grouping just barely fits inside the target.
- Cpk > 1.33: The process is considered capable. There is a comfortable buffer between the process variation and the specification limits. The archer’s arrows are tightly grouped in the center of the target, with plenty of room to spare. Many industries, especially automotive, require a Cpk of 1.67 or even 2.0 for critical components.
The Bridge Between PPM and Cpk: The Z-Score
The magic that connects PPM and Cpk is the Z-score, also known as the standard score. In quality statistics, the Z-score tells us how many standard deviations a data point is from the process mean (the average). The conversion relies on the assumption that the process data follows a normal distribution (a bell-shaped curve).
The PPM to Cpk calculator uses this statistical relationship. When you enter a PPM value, the calculator first determines the probability of a defect. It then uses the properties of the normal distribution to find the corresponding Z-score. Finally, it uses a simple formula: Cpk = Z-score / 3
Conversely, when you input a Cpk, the calculator reverses the process: Z-score = Cpk * 3
It then uses the Z-score to calculate the area under the “tails” of the bell curve, which represents the probability of a defect. This probability is then multiplied by one million to give you the PPM value.
Applications & Use Cases: Why This Matters
Converting between PPM and Cpk isn’t just an academic exercise. It has critical real-world applications across numerous industries.
- Manufacturing & Engineering: This is the most common use case. Engineers use the PPM to Cpk calculator to set quality targets. For instance, a client might demand a defect rate of less than 230 PPM. The engineer can use the calculator to determine that this requires achieving a Cpk of at least 1.5.
- Six Sigma & Lean Methodologies: Six Sigma is a data-driven methodology aimed at eliminating defects. The ultimate goal of “Six Sigma” quality is to achieve a process that produces only 3.4 defects per million opportunities (3.4 PPM). Using the calculator, you can see this corresponds to a Cpk of 2.0 (when accounting for a 1.5 sigma shift, a concept we’ll cover in the FAQs).
- Supplier Quality Management: When a company sources parts from a supplier, they often define quality requirements using Cpk. The supplier can then use this calculator to understand the expected PPM defect rate they must adhere to. It creates a common language for quality expectations.
- Process Comparison: Imagine you have two different machines producing the same part. Machine A has a Cpk of 1.2, and Machine B has a defect rate of 6,200 PPM. Which is better? By using the calculator, you can convert Machine B’s 6,200 PPM to a Cpk of approximately 1.1, making it clear that Machine A is the more capable process.
Related Calculators and Resources:
- PPM to Sigma Level Calculator
- Sigma to Cpk Calculator
- DPMO to Sigma and Yield Calculator
- Z-Score to PPM Converter
- Normal Distribution Calculator
- PPM Conversion Table
- How to Calculate PPM Step-by-Step
- PPM Accuracy Calculator
Frequently Asked Questions (FAQs)
1. What is considered a “good” Cpk value?
The definition of “good” depends heavily on the industry and the criticality of the component. However, here are some widely accepted benchmarks:
- Cpk < 1.0: Unacceptable. The process is not capable of meeting requirements.
- Cpk between 1.0 and 1.33: Marginally capable. The process needs monitoring and improvement.
- Cpk ≥ 1.33: Capable. This is often the minimum acceptable standard for many industries. It translates to about 63 PPM.
- Cpk ≥ 1.67: Excellent. This is a common requirement in the automotive and medical device industries. It translates to about 1 PPM.
- Cpk = 2.0: World-class or “Six Sigma” quality. This translates to 0.002 PPM (or 3.4 PPM if a 1.5 sigma shift is assumed).
2. What is the difference between Cp and Cpk?
Both are process capability indices, but they measure slightly different things.
- Cp (Process Capability): Measures the potential capability of your process. It only looks at the spread (variation) of your process relative to the specification width. It assumes your process is perfectly centered on the target.
- Cpk (Process Capability Index): Measures the actual capability of your process. It considers both the spread and the centering of the process.
Because Cpk accounts for being off-center, the Cpk value can never be higher than the Cp value. Cpk is the more realistic and widely used metric.
3. Does this calculator assume a 1.5 sigma shift?
No, this calculator performs a direct, purely statistical conversion without assuming a sigma shift. The 1.5 sigma shift is a concept from the Six Sigma methodology which suggests that over the long term, a process mean tends to drift by about 1.5 standard deviations from its short-term average. When this shift is factored in, a Cpk of 1.5 translates to the famous 3.4 PPM. Our calculator provides the direct mathematical equivalent, where a Cpk of 2.0 is required for 3.4 PPM if there were no shift.
4. Can I use this calculator for any type of process data?
This calculator assumes that your process data is normally distributed (i.e., it follows a bell curve). This is a very common assumption in quality control and holds true for many, but not all, manufacturing and transactional processes. If your data is heavily skewed or does not follow a normal distribution, the Cpk and PPM relationship will not be accurate, and more advanced statistical methods may be needed.
5. How can I improve my Cpk value?
Improving Cpk involves two main strategies:
- Reduce Variation: Make your process more consistent. This is the most common goal. It involves identifying sources of variation (e.g., machine wear, material differences, operator methods) and implementing controls to minimize them. This is like tightening the archer’s grouping of arrows.
- Center Your Process: Adjust your process to ensure the average output is as close to the target specification as possible. If your target is 10mm and your average is 10.2mm, you need to adjust the process to bring the average back to 10mm. This is like ensuring the archer is aiming at the center of the bullseye.
6. What does a Cpk of 1.0 mean in terms of PPM?
A Cpk of 1.0 means your process variation is exactly as wide as your specification limits. Statistically, this translates to approximately 2,700 PPM. This means you can expect 2,700 defective parts for every million produced. This is why a Cpk of 1.0 is considered only marginally capable; a 0.27% defect rate is too high for most modern applications.