
In modern manufacturing, measuring defects accurately is key to continuous improvement. Many production managers ask, “How do you calculate ppm in production?”
PPM – parts per million – is the universal way to express product quality or defect rate. It helps compare performance across plants, lines, and suppliers regardless of batch size.
This guide walks through what ppm means, how to calculate it, and why it matters in production management.
What Does PPM Mean in Production?
In production, PPM (parts per million) measures the number of defective units found in one million produced items.
It standardizes quality reporting so teams can talk about efficiency and waste using one simple metric.
If you manufacture 1 million parts and 250 are defective, your ppm = 250.
That’s 250 defects per million opportunities.
The PPM Formula in Production Quality
The standard formula is:
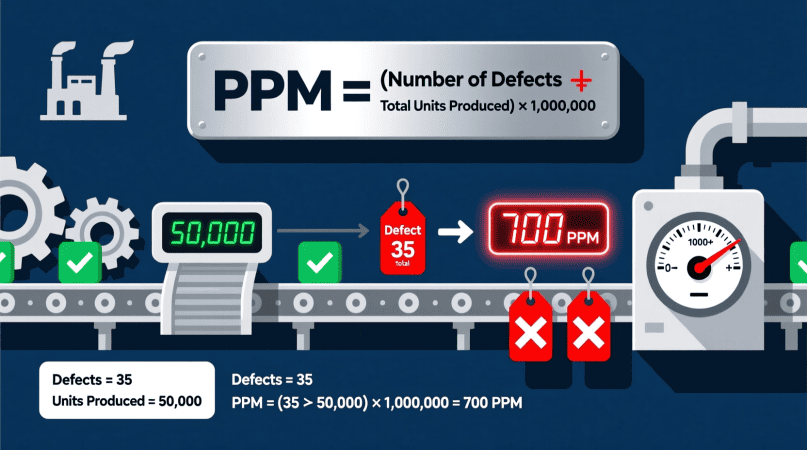
PPM = Number of Defects / Total Units Produced × 1,000,000
Example 1 – Basic Production Run
A factory produces 400 000 plastic caps in one day. There are 60 rejects after inspection.
60 / 400,000 ×1,000,000 = 150 ppm
That means 150 defective caps per million produced – a defect rate of 0.015 %.
You can double-check your math instantly with the PPM Calculator.
Converting Between PPM and Percentage Defective
Sometimes quality reports show percentages instead of ppm.
Use these quick conversions:
PPM=Percent Defective×10,000
Percent Defective = PPM / 10,000
Example 2
If your defect rate is 0.02 %, multiply by 10 000 → 200 ppm.
Conversely, 200 ppm ÷ 10 000 = 0.02 %.
You can confirm with the PPM to Percent Calculator.
Why PPM Matters in Production Monitoring
PPM lets production teams see exactly how well their process is performing.
Main Advantages
- Objective measurement: compares different lines or plants fairly.
- Benchmarking: track supplier quality or internal departments.
- Continuous improvement: reduces rework and scrap costs.
- Customer confidence: most OEM and ISO systems require ppm targets for suppliers.
If you need to analyze tolerances and precision, the PPM Accuracy Calculator is a useful tool.
PPM, Cpk and Process Capability in Production
PPM is closely linked to Cpk (Process Capability Index) – a statistical measure of how well a process fits its spec limits. Higher Cpk means fewer defects and lower ppm.
| Cpk | Sigma Level | Approx. Defects per Million |
|---|---|---|
| 1.0 | 3σ | 2 700 ppm |
| 1.33 | 4σ | 63 ppm |
| 1.67 | 5σ | 0.6 ppm |
| 2.0 | 6σ | 0.002 ppm |
Convert between capability and ppm with the Cpk to PPM Calculator or analyze reverse values via the PPM to CPK Calculator.
Real-World Example: Assembly Line PPM Analysis
A furniture hardware plant produces 1.5 million hinges per month. After testing, 120 hinges fail.
Step 1:
120 / 1,500,000×1,000,000 = 80 ppm
Step 2: Interpretation
80 ppm = 0.008 % defective.
That’s within the plant’s target of ≤ 100 ppm.
If the goal is 50 ppm next quarter, engineering must halve defects through process optimization and operator training.
For more guidance on reducing errors, read this guide on PPM Calculation Mistakes.
Using PPM Data for Continuous Improvement
When you track ppm regularly, you can link defects to root causes and prevent recurrence.
Typical approach:
- Collect defect counts per shift or batch.
- Plot a trend chart of ppm over time.
- Apply Pareto analysis to find major defect categories.
- Launch corrective actions and measure impact.
To calculate multiple processes together or simulate new targets, try the PPM Solution Calculator.
Common Questions About PPM in Production
1. What is a good ppm target in production?
- Automotive industry: ≤ 50 ppm
- Electronics and medical devices: ≤ 25 ppm
- General manufacturing: ≤ 1 000 ppm
2. Can ppm be used for service operations?
Yes. You can apply ppm to measure error rates in administration, packaging, or logistics.
3. How often should ppm be calculated?
Many plants review ppm daily for in-process defects and monthly for final quality reports.
4. What if multiple defects occur on one unit?
Decide whether to count each unit once or count each defect separately based on your quality policy.
Key Takeaways:
- Formula: Defects ÷ Total Produced × 1 000 000
- Use: Quantifies defects per million opportunities.
- Conversion: 1 % = 10 000 ppm.
- Goal: Lower ppm = higher quality.
- Tools: Use ppm calculators for accuracy and Cpk comparisons.
Matthew is a chemical technology enthusiast and the creator of PPMCalculator.com — a platform dedicated to simplifying complex concentration and conversion formulas for students, researchers, and industry professionals. With years of experience exploring water chemistry, environmental monitoring, and laboratory analysis, he focuses on making scientific accuracy both practical and accessible.
When not writing or developing new tools, Shimul enjoys testing real-world chemical measurements, refining calculator algorithms, and helping learners understand the science behind PPM, EC, and TDS.