
Cpk to PPM Calculator
Enter your process’s Cpk value to calculate the corresponding defective Parts Per Million (PPM), assuming a normal distribution.
Reference: Cpk to PPM Conversion
| Cpk | PPM (Defects per Million) |
|---|---|
| 0.67 | 45,500 |
| 1.00 | 2,700 |
| 1.33 | 63 |
| 1.50 | 6.8 |
| 1.67 | 0.57 |
| 2.00 | 0.002 |
Cpk to PPM Calculator – Easy Defect Rate Conversion Tool
Confused about converting Cpk to PPM? Use this simple tool to calculate defect rates, sigma level, and process performance with clear examples and explanations. Quickly convert Cpk to PPM and defect probabilities. Ideal for manufacturing engineers, quality control, and Six Sigma teams performing capability analysis and SPC reporting.
Problem Solved: How do I quickly and accurately convert my process capability index (Cpk) into a Parts Per Million (PPM) defect rate?
This calculator is designed for quality assurance managers, manufacturing engineers, and Six Sigma practitioners who need to translate a Cpk score into a more easily understood defect rate. Understanding your PPM is crucial for setting quality goals, communicating performance to leadership, and benchmarking against industry standards.
What is Cpk and PPM?
- Cpk (Process Capability Index): This metric measures how close a process is to its specification limits, relative to its variation. A higher Cpk value indicates a more capable process with less variability and fewer defects.
- PPM (Parts Per Million): This is a direct measure of the number of defective parts per million units produced. For example, a PPM of 3,400 means that for every one million parts manufactured, 3,400 are expected to be defective.
How Do I Use the CPK to PPM Calculator?
Our user-friendly tool simplifies this complex statistical conversion. Just follow these steps:
- Find Your Cpk Value: You’ll need to calculate your process’s Cpk from your statistical process control (SPC) data.
- Enter Cpk: Input your Cpk value into the calculator.
- Get Your PPM: Click “Calculate” to instantly see your process’s PPM defect rate.
Example Use Cases:
- Manufacturing: A production line for automotive parts has a Cpk of 1.33. You want to know the expected defect rate to report to a client. The calculator shows this corresponds to a PPM of approximately 63.4. This is a powerful, data-driven way to communicate quality performance.
- Six Sigma Projects: During a Six Sigma project, a team improves a process, raising the Cpk from 1.0 to 1.5. The calculator can instantly show the reduction in defects, demonstrating the project’s impact by converting the Cpk improvement into a tangible PPM drop.
- Quality Audits: When auditing a supplier, you receive their process capability data. You can use this calculator to verify their reported PPM and ensure their quality claims align with their Cpk scores.
It’s useful for turning raw data into accurate ppm values
Why is this conversion important?
While Cpk is a powerful statistical measure, PPM is a more intuitive and universal language for discussing quality and defects. A Cpk of 1.33 might not mean much to an executive, but a PPM of 63.4 immediately quantifies the financial and operational impact of defects.
Key Data Points and Outcomes:
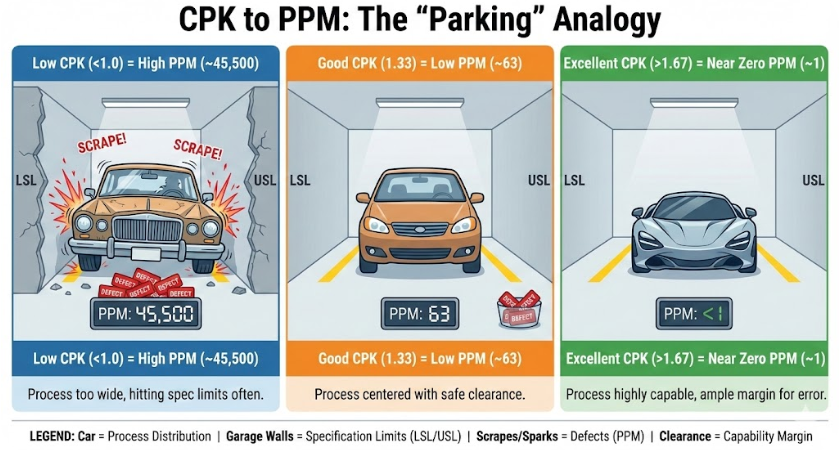
- Cpk 1.0: Corresponds to a PPM of ~2,700 (3 sigma quality). This is considered a barely capable process.
- Cpk 1.33: Corresponds to a PPM of ~63.4 (4 sigma quality). This is a widely accepted industry standard for many processes.
- Cpk 1.67: Corresponds to a PPM of ~0.57 (5 sigma quality). This represents world-class quality.
- Cpk 2.0: Corresponds to a PPM of ~0.002 (6 sigma quality). The gold standard for defect-free production.
This calculator provides a fast, reliable way to bridge the gap between these two critical quality metrics. It empowers teams to make better decisions and communicate process performance with clarity and authority.
A simple PPM Calculator for converting mg/L, mg/kg, dilution ratios, and chemical concentrations. Perfect for students, home labs, aquariums, and everyday chemistry use.