
In manufacturing, every fraction of a defect counts. Quality engineers often use parts per million (PPM) to measure how many defective units occur in a production batch. If you’ve ever asked “how do I calculate parts per million in manufacturing?”, this guide explains it clearly—with formulas, examples, and easy ways to verify your numbers.
What Is Parts Per Million (PPM) in Manufacturing?
PPM (parts per million) expresses the ratio of defective items to the total number produced, normalized to one million.
It allows companies to compare quality performance across lines, suppliers, or facilities, no matter how large the production volume.
In plain language, PPM tells you how many defects would appear if you made exactly 1 million parts.
If you need a refresher on what ppm means in chemistry and industry, check our PPM Glossary.
The Formula for PPM in Manufacturing Quality
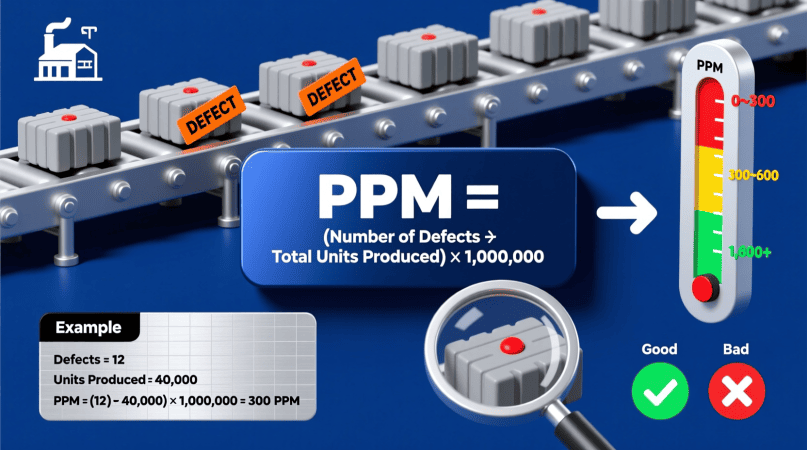
The calculation is straightforward:
PPM = Number of Defective Units / Total Units Produced× 1,000,000
Example:
Your factory produced 500,000 components last month, and 25 failed inspection.
PPM = 25/500,000× 1,000,000 = 50 ppm
So you have 50 defects per million—a strong indicator of consistent quality.
To double-check calculations automatically, try the free PPM Calculator.
Converting Between PPM and Percent Defective
PPM and percent defective express the same thing in different scales.
Use these quick conversions:
PPM=Percent Defective×10,000
[Percent Defective} = PPM/10,000
Example:
A defect rate of 0.008 % equals 80 ppm.
You can confirm this instantly with our PPM to Percent Calculator.
Why Manufacturers Track PPM
PPM isn’t just a number—it’s a universal language of quality.
Key Reasons to Measure:
- Benchmark suppliers using one consistent metric
- Track continuous improvement efforts
- Meet ISO and Six Sigma requirements
- Spot early process drift before costly rework
Lower PPM means higher quality. World-class manufacturers often target below 50 ppm, while Six Sigma processes aim for 3.4 ppm or less.
To explore accuracy and tolerance levels, see the PPM Accuracy Calculator.
PPM, CPK and Process Capability
Process capability studies link Cpk values to ppm defects.
Higher Cpk means a more stable process and fewer defects.
| Cpk | Sigma Level | Approx. PPM Defects |
|---|---|---|
| 1.0 | 3σ | 2,700 ppm |
| 1.33 | 4σ | 63 ppm |
| 1.67 | 5σ | 0.6 ppm |
| 2.0 | 6σ | 0.002 ppm |
You can convert between capability and ppm using the Cpk to PPM Calculator.
This helps managers visualize how statistical process control (SPC) improvements reduce defects at scale.
Real-World Example: Automotive Parts Plant
An automotive supplier produced 1.2 million fasteners last quarter and found 96 non-conforming items.
Step 1:
PPM = 96 /1,200,000 × 1,000,000 = 80 ppm
Step 2:
Convert to percent:
80/10,000 = 0.008 %
Interpretation:
The plant achieved 99.992 % quality. Their target is ≤ 100 ppm, so the process meets expectations.
To refine this data further, compare with other indicators in the PPM to CPK Calculator.
PPM in Supplier Quality and Customer Reports
Suppliers often submit monthly PPM performance reports to OEMs.
A typical dashboard includes:
- Total parts shipped
- Defects found in incoming inspection
- Calculated PPM
- Corrective actions for recurring issues
These reports build trust and help customers verify supplier capability.
To ensure consistent data entry, use a digital tool like the PPM Solution Calculator.
Common Mistakes When Calculating PPM
Even simple errors can distort quality metrics:
- Incorrect unit counts – forgetting reworked items or multiple defects per unit.
- Using percent instead of decimal values in the formula.
- Mixing time frames – comparing weekly ppm to monthly totals.
- Ignoring sample size bias in short-run production.
Learn how to avoid these pitfalls in our PPM Calculation Mistakes guide.
How to Use PPM for Continuous Improvement
Once you calculate ppm defects, analyze patterns:
- Pareto analysis: Which defect types cause most losses?
- Root-cause analysis: Why do they occur?
- Corrective actions: What controls prevent recurrence?
Over time, tracking ppm alongside OEE and scrap rate gives a complete view of manufacturing efficiency.
For related applications in production and process testing, visit our homepage at PPM Calculator.
Key Takeaways:
- PPM Formula: Defects ÷ Total Production × 1,000,000
- 1 % defective = 10,000 ppm
- Goal: Lower ppm = higher quality and process capability
- Use Cpk and Sigma metrics to benchmark performance
- Automate your math with ppm calculators and avoid manual mistakes
PPM turns raw defect data into actionable insight, helping manufacturers track continuous improvement and prove quality to their customers.
Matthew is a chemical technology enthusiast and the creator of PPMCalculator.com — a platform dedicated to simplifying complex concentration and conversion formulas for students, researchers, and industry professionals. With years of experience exploring water chemistry, environmental monitoring, and laboratory analysis, he focuses on making scientific accuracy both practical and accessible.
When not writing or developing new tools, Shimul enjoys testing real-world chemical measurements, refining calculator algorithms, and helping learners understand the science behind PPM, EC, and TDS.